Polymarket US Volume: Daily, Weekly & Monthly
Polymarket US trading, the last 30 days
Polymarket US handled $16M of prediction-market trading over Aug 26-Sep 24, 2026, under 1% of the total and up 59% from the 30 days before.
Up 59%vs. the 30 days before
Aug 26-Sep 24, 2026.
Kalshi 85% and Polymarket 14%.
407,007 trades in the window.
| 1Sports | $16M | 100.0% | +59.5% |
|---|
Polymarket US month by month and week by week
Polymarket US has traded $99M in 2026, through Sep 25, 2026. Its busiest whole month was June, with $59M.
| Month | Volume | vs. month before | Year to date |
|---|---|---|---|
| June | $59M | – | $59M |
| July | $17M | −71% | $76M |
| August | $6.6M | −62% | $83M |
| Septemberto Sep 25 | $16M | – | $99M |
Polymarket US’s share of the venues’ volume went from under 1% in the week of Jul 6 to under 1% in the week of Sep 21 (so far).
The 12 weeks as a table
| Week | Volume | Share of all venues |
|---|---|---|
| Jul 6 to Jul 12 | $5.1M | under 1% |
| Jul 13 to Jul 19 | $2.9M | under 1% |
| Jul 20 to Jul 26 | $1.1M | under 1% |
| Jul 27 to Aug 2 | $4.5M | under 1% |
| Aug 3 to Aug 9 | $4.8M | under 1% |
| Aug 10 to Aug 16 | $538K | under 1% |
| Aug 17 to Aug 23 | $0 | 0.0% |
| Aug 24 to Aug 30 | $20K | under 1% |
| Aug 31 to Sep 6 | $40K | under 1% |
| Sep 7 to Sep 13 | $3.3M | under 1% |
| Sep 14 to Sep 20 | $9M | under 1% |
| Sep 21 to Sep 27so far | $3.7M | under 1% |
Sources: Kalshi / Polymarket / Polymarket US via DeFi Rate, observed · Every venue’s volume; DeFi Rate (daily volume by venue through Sep 25, 2026, UTC days), observed .
DeFi Rate tracks trading volume on Polymarket US, Polymarket’s CFTC-regulated exchange for customers in the United States. The figures below cover the last 30 days, Polymarket US’s share of prediction-market volume, its busiest categories and markets, and its daily, weekly and monthly history. They sit alongside our Kalshi volume and Polymarket volume pages, and the prediction market volume page compares every venue.
Polymarket US 30-day volume and market share
The dollar value of contracts traded on Polymarket US over the last 30 days, the change from the 30 days before, and its share of all prediction-market volume we track.
Daily, weekly and monthly volume
Dollars traded each day over the last 30 days, then each month and week of the year with a running year-to-date total.
Volume by category and most-traded markets
Which kinds of markets drive trading on Polymarket US, sports, politics, crypto and more, and the individual markets with the most volume.
Methodology
Volume is the dollar value of contracts traded, counted once per trade, from DeFi Rate’s licensed market data. Polymarket US and Polymarket’s international exchange are separate venues with separate order books, so we count them separately: this page covers Polymarket US only. Days are UTC. Figures update through the day, and every chart shows when its data was observed.
Polymarket US is newer and smaller than Polymarket’s international exchange, so its history is shorter and a single busy event can move its totals a lot. Read our Polymarket review for how the app works and who can use it.
- What is Polymarket US?
Polymarket US is Polymarket’s exchange for customers in the United States, regulated by the CFTC. It lists its own markets and keeps its own order books, separate from Polymarket’s international exchange.
- How is Polymarket US trading volume calculated?
Volume is the notional value traded: the number of contracts bought and sold multiplied by the price paid, counted once per trade. It isn’t open interest and doesn’t include fees. All figures are in US dollars.
- Is Polymarket US volume included in Polymarket’s volume?
No. We report Polymarket US and Polymarket’s international exchange as two venues. The prediction market volume page shows both side by side with Kalshi.
- How often is this data updated?
Through the day. The 30-day figures and daily chart refresh as new trades are recorded, and each section shows when it was observed.
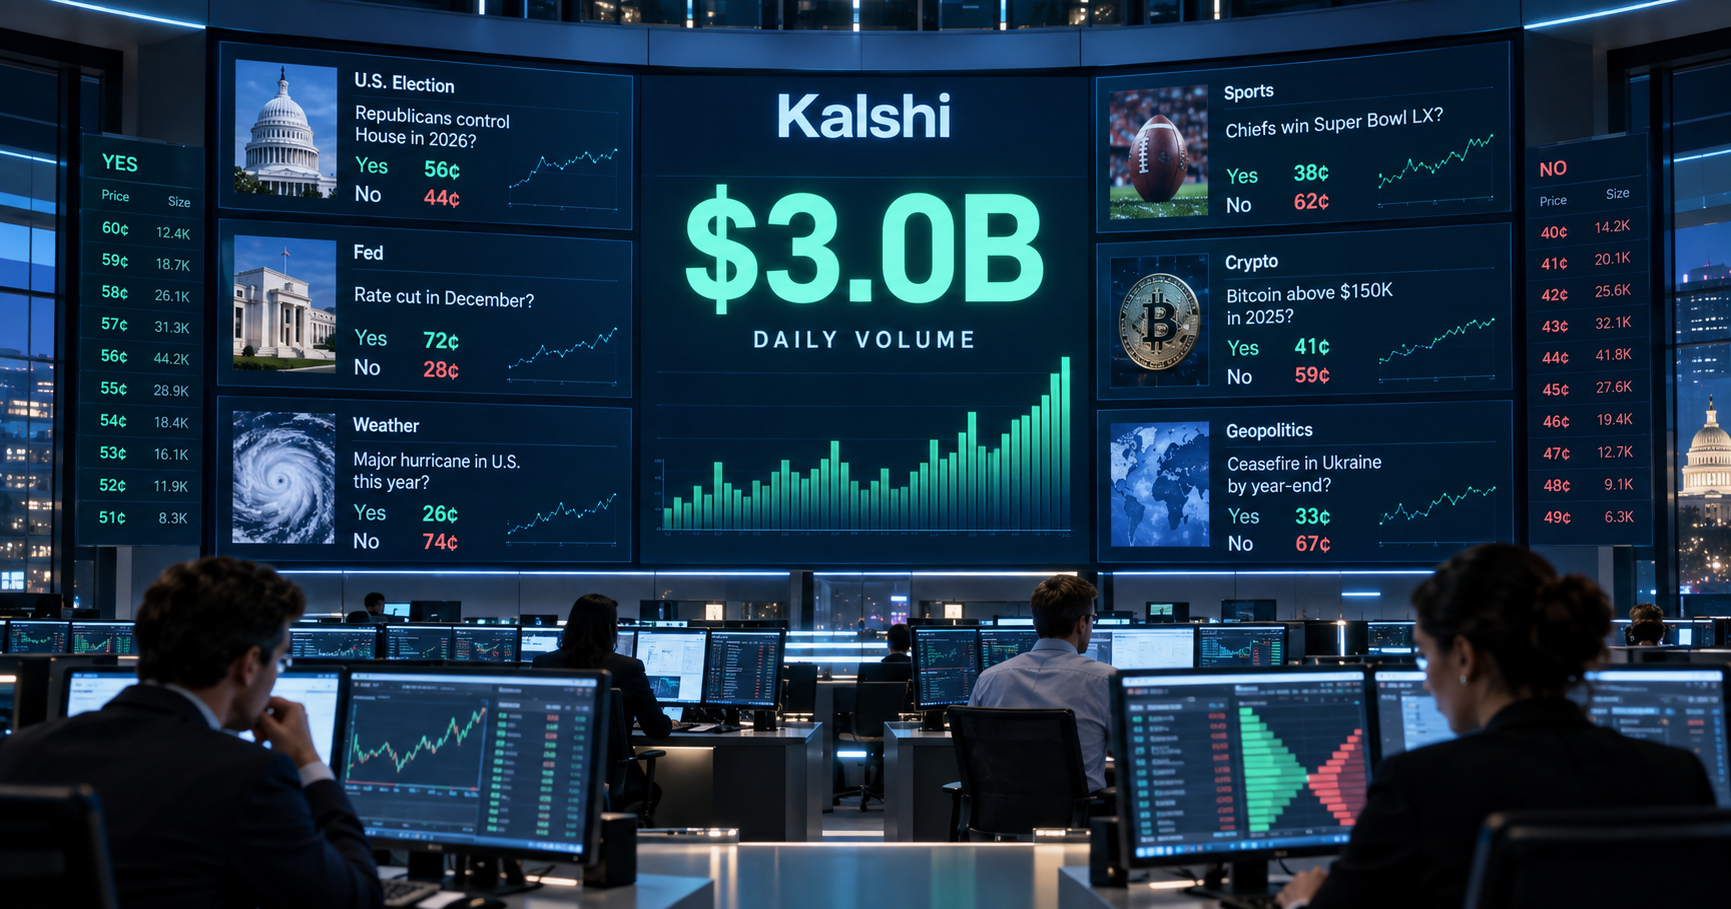 Kalshi Volume Sets 2026 High at $15.27B With First $3 Billion Day
 NFL Prediction Market Volume Tops $1.035B as Kalshi Reaches $983.36M
 Patriots-Seahawks Prediction Market Volume Jumps from $5.8M to $105.5M in 24 Hours
 Prediction Market NFL Trading Volume Could Reach $57 Billion This Season