


The headline number $5.89B across all tracked prediction market platforms for the week of March 2–8 looks like a near-repeat of the week prior, but that’s not exactly the case. The total came in virtually flat (-0.4% WoW) only because Kalshi and Polymarket each gained ground while the rest of the tracked field shed volume heavily. That includes Opinion Labs, which has shown a decline of 87% over five weeks.
Strip out the smaller exchanges, and the two-platform combined figure of $5.35B is the highest on record, surpassing the prior record of $5.13B set in the previous week (Feb. 23-March 1).
- Kalshi: $2.86B (+4.7% WoW)
- Polymarket: $2.50B (+4.0% WoW)
- Kalshi + Polymarket combined: $5.35B (+4.4% WoW)
Not included in Dune’s overall tracking numbers is Polymarket US, now tracked live on our DeFi Rate prediction markets tracker. Polymarket US posted $5.9 million in notional volume for the week of March 2, little change from the week prior. The platform is still new after starting a slow rollout in December 2025, and still only offers sports markets.
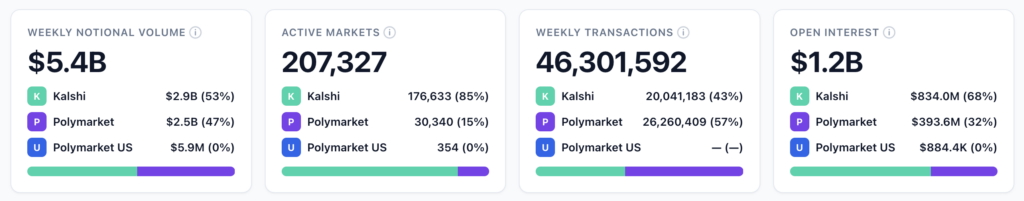
According to our tracking, Kalshi and Polymarket global + US platform currently offer a combined 207,327 active markets with the majority coming from Kalshi (85%). Open interest currently stands at $1.2B, split 68% Kalshi / 32% Polymarket. Despite less volume and many fewer markets, Polymarket still had more weekly transactions with 26.2 million to Kalshi’s 20.0 million. As you can see from the data snapshot, Polymarket US remains tiny in comparison to Kalshi and its own global platform.
As we await an expected volume boost from the NCAA March Madness tournament, politics and crypto remain important trading drivers as Kalshi’s “exotics” category also surges. Let’s dig in.
Kalshi vs. Polymarket — head to head
Kalshi and Polymarket moved in lockstep this week, with both platforms posting gains in volume and transactions simultaneously for the first time in several reporting periods. Kalshi grew 4.7% to $2.86B while Polymarket grew 4.0% to $2.50B. The combined $5.35B eclipsed the prior record set just last week.
The transaction story runs parallel. Kalshi processed 20.0M transactions (+7.0% WoW) and Polymarket had 26.3M (+6.6% WoW), bringing the two-platform total to 46.3M. As has been the pattern for months, Polymarket leads in transaction count while Kalshi leads in dollar volume, a structural divergence that reflects Kalshi’s higher average trade size ($143 vs. Polymarket’s $95). Both figures dipped slightly WoW (-2.2% and -2.5% respectively), suggesting the volume growth was transaction-driven rather than a shift toward larger individual positions.
Market share between the two platforms has settled into a narrow band. Kalshi holds 53.4% of the combined two-platform volume, essentially unchanged from 53.2% the week prior. That stability comes despite very different category compositions. Kalshi’s week, per usual, was overwhelmingly sports-driven while Polymarket’s gains came from a surge in sports volume.
Kalshi vs. Polymarket 6-week volume trend (Jan. 26-March 8)
Kalshi vs. Polymarket: 6-week volume trend
Weekly notional volume, Jan. 26 – Mar. 2, 2026
| Week of | Kalshi | Polymarket | Combined |
|---|---|---|---|
| Jan. 26 | $2,195.1M | $2,082.8M | $4,277.9M |
| Feb. 2 | $2,796.7M | $1,915.4M | $4,712.1M |
| Feb. 9 | $2,428.2M | $1,879.6M | $4,307.8M |
| Feb. 16 | $2,592.0M | $1,820.0M | $4,412.0M |
| Feb. 23 | $2,729.4M | $2,400.2M | $5,129.6M |
| Mar. 2 | $2,858.1M | $2,496.4M | $5,354.5M |
Kalshi vs. Polymarket metrics week over week
| Metric | Kalshi | WoW Δ | Polymarket | WoW Δ |
|---|---|---|---|---|
| Volume | $2.86B | +4.7% | $2.50B | +4.0% |
| Transactions | 20,041,183 | +7.0% | 26,260,409 | +6.6% |
| Avg. bet size | $142.62 | -2.2% | $95.06 | -2.5% |
| Market share | 53.4% | — | 46.6% | — |
Source: DeFi Rate. Week ending March 8, 2026.
Polymarket US highlights
Polymarket US generated $5.9M in weekly volume for the week of March 2–8, holding roughly steady compared to the prior week. The product remains sports-only and all 15 top markets by volume last week were NBA game lines, led by Oklahoma City Thunder vs. New York Knicks (March 4) at $532.9K. That top-market figure is down modestly from the prior week’s leader of $584.8K, and the ceiling across the top 15 markets hasn’t shifted meaningfully: every tracked market came in under $600K.
The gap against Kalshi’s sports markets remains substantial. For comparison, Kalshi’s top market this week (UFC 326: Holloway vs. Oliveira) did $17.9M, roughly 34x the Polymarket US leader. With 354 active markets and trading category rollout coming along slowly, Polymarket US is still in early stages.
Polymarket US weekly snapshot (March 2-8)
| Metric | March 2-8 |
|---|---|
| Volume | $5.9M |
| Active markets | 354 |
| Open interest | $884.4K |
| Top market | Oklahoma City Thunder vs. New York Knicks |
| Top market volume | $532.9K |
Polymarket US Top 10 markets by volume, last 7 days
Polymarket US — top 10 markets by volume
Last 7 days ending Mar. 8, 2026
| # | Market | Volume (7d) |
|---|---|---|
| 1 | Polymarket USOklahoma City vs. New York | $532.9K |
| 2 | Polymarket USDenver vs. Utah | $515.3K |
| 3 | Polymarket USLos Angeles Clippers vs. Golden State | $494.8K |
| 4 | Polymarket USLos Angeles Clippers vs. Memphis | $457.5K |
| 5 | Polymarket USBoston vs. Cleveland | $438.2K |
| 6 | Polymarket USUtah vs. Washington | $415.5K |
| 7 | Polymarket USGolden State vs. Houston | $405.8K |
| 8 | Polymarket USBoston vs. Milwaukee | $398.5K |
| 9 | Polymarket USChicago vs. Phoenix | $394.7K |
| 10 | Polymarket USAtlanta vs. Milwaukee | $387.0K |
Section 3: Full platform volume comparison
Total tracked prediction market volume for the week of March 2–8 came in at $5.89B across all platforms, fractionally below the prior week’s $5.92B (-0.4% WoW). The near-flat headline masks a significant reordering in the tier below Kalshi and Polymarket: Opinion Markets fell 57.0% to $155.8M, predict.fun dropped 55.4% to $77.2M, and Overtime declined 10.7% to $3.9M.
Crypto.com, just added to Dune Analytics tracking, was the standout gainer among smaller platforms ($122.6M, +15.0% WoW).
Full platform volume comparison (week of Mar. 2–8)
Full platform volume comparison — week of Mar. 2–8, 2026
All tracked prediction market platforms by weekly notional volume
| Platform | Volume | WoW Δ | Share |
|---|---|---|---|
| Kalshi | $2,858.1M | +4.7% | 48.5% |
| Polymarket | $2,496.4M | +4.0% | 42.4% |
| Opinion Markets† | $155.8M | -57.0% | 2.6% |
| Crypto.com | $122.6M | +15.0% | 2.1% |
| predict.fun† | $77.2M | -55.4% | 1.3% |
| Other (incl. Overtime) | $179.8M | —‡ | 3.1% |
| Total | $5,889.8M | -0.4% | 100% |
†Opinion Markets and predict.fun volumes may be inflated by non-organic activity. ‡Other WoW comparison affected by composition change; includes Overtime, Limitless, ForecastEx, Myriad, and other tracked platforms.
All tracked platforms: Volume, transactions, market share WoW (week of March 2-8)
| Platform | Volume | WoW Δ | Transactions | WoW Δ | Market share |
|---|---|---|---|---|---|
| Kalshi | $2.86B | +4.7% | 20,041,183 | +7.0% | 48.5% |
| Polymarket | $2.50B | +4.0% | 26,260,409 | +6.6% | 42.4% |
| Crypto.com | $122.6M | +15.0% | — | — | 2.1% |
| Opinion Markets† | $155.8M | -57.0% | 105,658 | -47.7% | 2.6% |
| predict.fun† | $77.2M | -55.4% | 111,958 | -58.1% | 1.3% |
| Other* | $175.9M | +26.9%** | 730,940 | — | 3.0% |
| Overtime | $3.9M | -10.7% | 13,059 | -12.2% | 0.1% |
| Total | $5,889.8M | -0.4% | 47,263,207 | +6.5% | 100% |
†See methodology note below.
*Crypto.com transactions included in Other. **Other WoW comparison reflects composition change: Crypto.com was named separately beginning Feb. 23.
Source: Dune Analytics, week ending March 8, 2026.
Smaller platform highlights
Opinion Markets: Opinion shed more than half its volume in a single week, falling from $362.5M to $155.8M. That continues a five-week slide from the platform’s $1.24B peak in early February, a drop of 87% over the period. Transaction counts followed the same direction, falling nearly 48% WoW to 105,658. We have previously flagged issues with Opinion’s volume figures, which are likely inflated by wash trading and other factors.
predict.fun: predict.fun also declined sharply, dropping 55.4% to $77.2M after averaging roughly $180M over the prior three weeks. The pullback comes without an obvious single-event explanation, pointing more toward a normalization from elevated levels than any platform-specific development.
Crypto.com: The one notable mover in the other direction: Crypto.com grew 15.0% to $122.6M, and was just recently added to the Dune dataset as a standalone platform.
Note on Opinion Markets and predict.fun volumes:
Opinion Markets and predict.fun are included in our tracked universe for completeness, but ongoing analysis of their on-chain metrics suggests their reported volumes may be significantly inflated by wash trading or other non-organic activity. We recommend treating their figures as directional indicators rather than reliable volume signals, and focusing on Kalshi and Polymarket for market-wide context. We’ll update this note if the methodological picture changes.
Category breakdown: Kalshi vs. Polymarket
The most notable development inside the Kalshi category data this week was the explosion in Exotics volume. The category surged 151.4% WoW from $152.3M to $382.9M, leaping past crypto ($258.6M) to become Kalshi’s second-largest category behind sports. The Exotics classification on Kalshi captures non-standard contract types — parlays and combination markets — making the surge a signal about how bettors are using the platform rather than what they’re betting on. Sports volume dipped modestly to $1.99B (-4.1% WoW), its second consecutive weekly decline after the post-Super Bowl peak. Politics fell 43.5% to $65.2M, after a trading spike the previous week on the Khamenei out as Supreme Leader of Iran market.
Politics also dropped WoW at Polymarket. After topping $666M the previous week on the back of Khamenei-driven contract activity, politics dropped 23.7% to $508.7M, still elevated by historical standards, but below the prior week’s spike. Sports surged 23.1% to $1.02B as Polymarket processed significant volume across NBA and soccer markets, a meaningful jump that pushed sports above $1B for the first time in our tracked dataset for Polymarket alone. Crypto held nearly flat at $723.7M (+2.0%), while the Trump-specific category climbed 35.0% to $157.0M.
The cross-platform comparison this week shows the two platforms converging on sports while continuing to diverge everywhere else. Sports combined for $3.01B — $1.99B on Kalshi, $1.02B on Polymarket — making it the largest single category across both platforms by a wide margin. Crypto is the second-largest combined category at $982.3M ($723.7M Polymarket, $258.6M Kalshi), with Polymarket holding a nearly 3:1 advantage in crypto volume. Politics presents a similar imbalance: Polymarket’s $508.7M dwarfs Kalshi’s $65.2M, a gap consistent with the user base differences between the two platforms.
Kalshi vs. Polymarket Category Comparison (March 2-8)
Category breakdown: Kalshi vs. Polymarket
Top 5 categories by weekly volume — week of Mar. 2–8, 2026
| Category | Kalshi | K WoW Δ | Polymarket | P WoW Δ |
|---|---|---|---|---|
| Sports | $1,993.3M | -4.1% | $1,018.5M | +23.1% |
| Exotics (Kalshi) | $382.9M | +151.4% | — | — |
| Crypto | $258.6M | +3.2% | $723.7M | +2.0% |
| Politics | $65.2M | -43.5% | $508.7M | -23.7% |
| Trump (Polymarket) | — | — | $157.0M | +35.0% |
| Economics / Finance | $19.2M | +5.5% | $22.8M | -5.8% |
| Entertainment / Culture | $14.6M | -24.4% | $30.2M | +11.9% |
| Other | $124.3M | — | $35.5M | — |
| Total | $2,858.1M | +4.7% | $2,496.4M | +4.0% |
Biggest category movers WoW for Kalshi and Polymarket
Biggest category movers week over week — Mar. 2–8, 2026
WoW % change by category, Kalshi and Polymarket
| Category | Platform | WoW Δ | This week | Prior week |
|---|---|---|---|---|
| Exotics | Kalshi | +151.4% | $382.9M | $152.3M |
| Sports | Polymarket | +23.1% | $1,018.5M | $827.5M |
| Trump | Polymarket | +35.0% | $157.0M | $116.3M |
| Crypto | Kalshi | +3.2% | $258.6M | $250.7M |
| Sports | Kalshi | -4.1% | $1,993.3M | $2,078.4M |
| Entertainment/Culture | Kalshi | -24.4% | $14.6M | $19.3M |
| Politics | Polymarket | -23.7% | $508.7M | $666.7M |
| Politics | Kalshi | -43.5% | $65.2M | $115.5M |
Top markets: Kalshi and Polymarket
Kalshi’s top market list this week was almost entirely NBA, with one notable exception: UFC 326 (Holloway vs. Oliveira) cleared $17.9M to take the top spot, the first non-NBA market to lead the Kalshi board in recent weeks. Six separate NBA games followed in positions 2-6, led by LA Clippers at San Antonio Spurs ($15.8M) and LA Lakers at Denver Nuggets ($12.9M), with Golden State Warriors at Houston Rockets ($12.6M) and Oklahoma City Thunder at New York Knicks ($11.6M) also clearing $10M.
Two T20 Cricket World Cup (international cricket) markets appeared at positions six and nine — WC Semifinals: England vs India ($11.2M) and the T20 Final: India vs New Zealand ($9.4M) — signaling growing traction for cricket markets on the platform.
Polymarket’s top markets were defined by the Khamenei cluster. The “Khamenei out as Supreme Leader by Feb 28?” contract settled at $118.7M to lead all Polymarket markets for the week. Two related Iran contracts — “Khamenei out by March 31?” ($46.4M) and “Next Supreme Leader of Iran?” ($34.2M) — combined with the Feb 28 market for roughly $199M across the three, making Khamenei the week’s single most-traded topic across the entire sample.
The Fed Chair nomination market (Who will Trump nominate as Fed Chair? — resolved to Kevin Warsh, $77.3M) and the March Fed decision market ($91.4M, 98% pricing no cut) rounded out the top five. The EPL Winner, 2026 NBA Champion, and 2028 Democratic Presidential Nominee markets all carried meaningful open interest, signaling continued long-horizon engagement.
Kalshi Top 15 markets by volume, last 7 days
Kalshi — top 15 markets by volume
Last 7 days ending Mar. 8, 2026
| # | Market | Volume (7d) |
|---|---|---|
| 1 | KalshiUFC 326: Holloway vs OliveiraSports | $17.9M |
| 2 | KalshiLos Angeles Clippers at San AntonioSports | $15.8M |
| 3 | KalshiLos Angeles Lakers at DenverSports | $12.9M |
| 4 | KalshiGolden State at HoustonSports | $12.6M |
| 5 | KalshiOklahoma City at New YorkSports | $11.6M |
| 6 | KalshiWC Semifinals: England vs IndiaSports | $11.2M |
| 7 | KalshiAtlanta at MilwaukeeSports | $10.7M |
| 8 | KalshiArnold Palmer Invitational WinnerSports | $9.8M |
| 9 | KalshiT20 World Cup Final: India vs New ZealandSports | $9.4M |
| 10 | KalshiChicago at PhoenixSports | $9.0M |
| 11 | KalshiLos Angeles Clippers at MemphisSports | $8.9M |
| 12 | KalshiLos Angeles Clippers at Golden StateSports | $8.7M |
| 13 | KalshiTexas Tech at BYUSports | $8.1M |
| 14 | KalshiNew York at Los Angeles LakersSports | $8.1M |
| 15 | KalshiBoston at ClevelandSports | $8.1M |
Polymarket Top 15 markets by volume, last 7 days
Polymarket — top 15 markets by volume
Last 7 days ending Mar. 8, 2026
| # | Market | Volume (7d) | Open int. |
|---|---|---|---|
| 1 | PolymarketKhamenei out as Supreme Leader by Feb 28?Politics | $118.7M | $0 |
| 2 | PolymarketFed decision in March?EconomicsActive | $91.4M | $23.1M |
| 3 | PolymarketWho will Trump nominate as Fed Chair?Politics | $77.3M | $0 |
| 4 | PolymarketEnglish Premier League WinnerSportsActive | $62.0M | $2.7M |
| 5 | Polymarket2026 NBA ChampionSportsActive | $56.3M | $1.0M |
| 6 | PolymarketLa Liga WinnerSportsActive | $48.0M | $987.2K |
| 7 | PolymarketKhamenei out as Supreme Leader by March 31?Politics | $46.4M | $0 |
| 8 | PolymarketElon Musk tweet count Feb 24–Mar 3Politics | $44.9M | $0 |
| 9 | PolymarketDemocratic Presidential Nominee 2028PoliticsActive | $42.3M | $8.8M |
| 10 | PolymarketUS next strikes Iran on…?Politics | $39.8M | $0 |
| 11 | Polymarket2026 FIFA World Cup WinnerSportsActive | $36.9M | $1.6M |
| 12 | PolymarketNext Supreme Leader of Iran?Politics | $34.2M | $0 |
| 13 | PolymarketElon Musk tweet count Feb 27–Mar 6Politics | $28.4M | $0 |
| 14 | PolymarketPresidential Election Winner 2028PoliticsActive | $23.8M | $4.8M |
| 15 | PolymarketWill Iran close the Strait of Hormuz by…?PoliticsActive | $20.3M | $3.6M |
Forward look
Selection Sunday is March 15. That single date has historically been a huge sportsbook volume driver — not because of the games, but because of the bracket. March Madness futures, first-round game lines, and team-specific props typically generate a surge of activity in the 48 hours following bracket reveal, with volume sustaining through the first weekend of play (March 19–22). The NCAA Tournament represents the only event on the sports calendar that consistently rivals Super Bowl week in terms of sheer market count and betting activity. While World Cup trading and primary elections will also bring significant volume spikes in the coming months, March Madness is the next major driver.
The macro calendar adds to the setup. The Federal Reserve meets March 18–19, with Polymarket’s March fed decision market already pricing a 98% probability of no cut and carrying $23.1M in open interest. That market will see elevated activity as the meeting approaches and will settle shortly after the announcement. The combination of a major sports event and a high-profile macro resolution in the same 10-day window creates a natural foundation for a volume surge. Expect the latest combined K+P record set this week to be eclipsed soon, and frequently in the coming weeks.