



Kalshi is turning its election markets into a full-scale forecasting product ahead of the November midterms, launching a new hub that combines live market probabilities with national maps, projected seat totals, polling, campaign-finance data and a historical record of how traders’ expectations have changed.
The Midterms Hub organizes Kalshi’s House, Senate and gubernatorial markets into separate interactive dashboards, with a fourth Balance of Power tab incorporating the company’s American Power Index, or KPOW.
The product is aimed well beyond customers looking to place a trade. In a news release, Kalshi said about three-quarters of visitors to its platform come only to check the latest probabilities, while roughly one in four actually trades. The company is positioning the hub as an information source for campaigns, political professionals, journalists, researchers and members of the public tracking the election.
“Prediction markets don’t care about spin or partisanship. They cut through polarization and show you what the wisdom of the crowds actually believes, backed by real money, not rhetoric,” Kalshi co-founder and CEO Tarek Mansour said in the release. “That kind of clarity is rare right now and that’s what people are getting with the Midterms Hub.”
The launch reflects Kalshi’s effort to make prediction market prices part of the broader political information ecosystem alongside polling averages, campaign-finance reports and traditional election forecasts. The dashboards let users filter maps by race rating, rewind forecasts to earlier points in the campaign and click directly into individual markets for additional polling and fundraising data, features designed to make the platform useful even to people who never place a trade.

Maps turn market prices into national forecasts
As of Wednesday morning’s Midterms Hub launch, Kalshi showed Democrats with an 83% chance of controlling the House and Republicans a 56% chance of retaining the Senate. Its gubernatorial forecast showed Democrats favored to hold 24 governorships, Republicans 22 and four races classified as toss-ups.
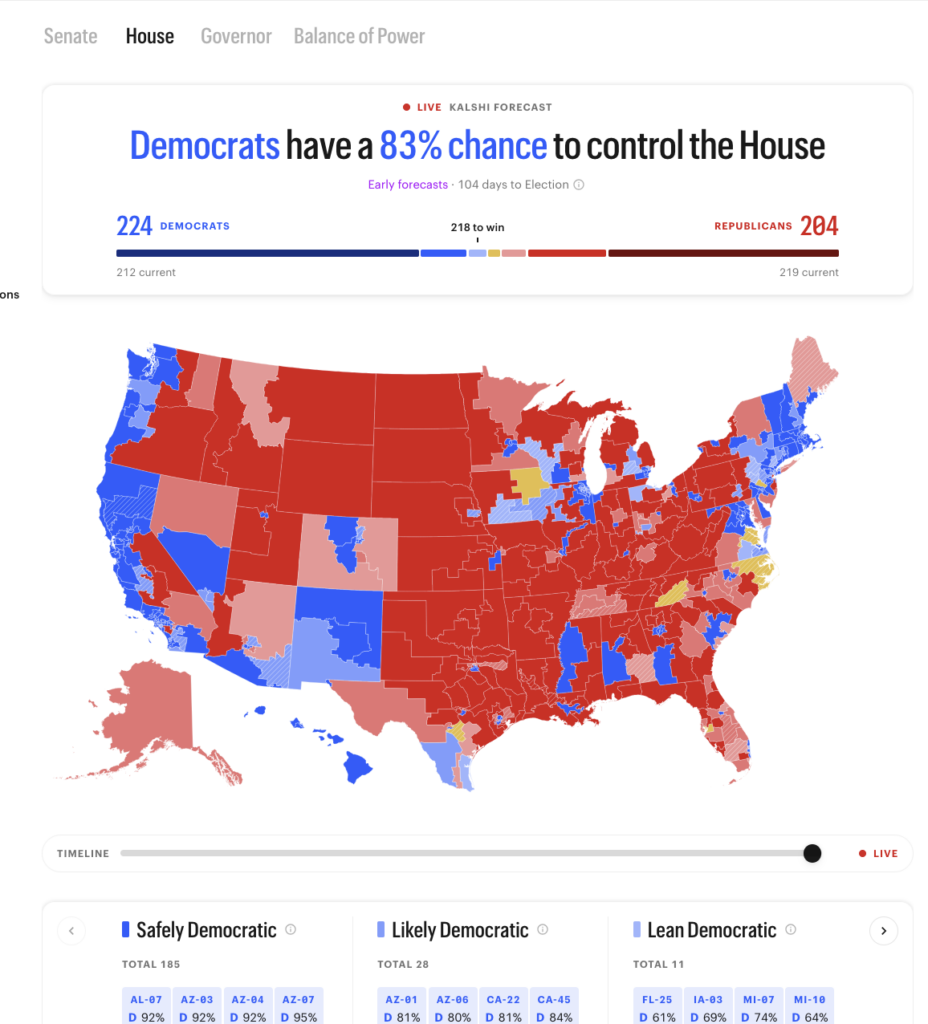
The congressional dashboards also translate individual race probabilities into projected seat totals. The House page showed Democrats favored in 224 districts and Republicans in 204, with seven seats left in the toss-up category. The Senate page had Democrats favored in 49 seats and Republicans in 48, with three races rated as toss-ups.
Each page centers on an interactive national map, with races divided into safely Democratic, likely Democratic, leaning Democratic, toss-up, leaning Republican, likely Republican and safely Republican categories. Clicking a segment in the color-coded bar above the map filters the display to show only races in that category, making it easier to isolate competitive contests or seats leaning toward one party.
The maps also link the broader forecast directly to Kalshi’s markets. Clicking a state or congressional district opens a panel showing the relevant race, current probabilities and trading volume, with another click taking users to the full market page. The House dashboard separately identifies seats projected to change party control, while all three pages highlight the most-traded races and related combo markets.
Historical tools show how forecasts moved
A timeline slider beneath the House, Senate and governor maps lets users rewind the election cycle and see how Kalshi odds looked at earlier points in the campaign. The feature makes it possible to track when a race shifted and whether the movement persisted or later reversed.
For House races, Kalshi says the timeline always uses the congressional districts in effect as of July 21. Rewinding to a date before a redistricting change therefore does not recreate the district map that existed at the time.
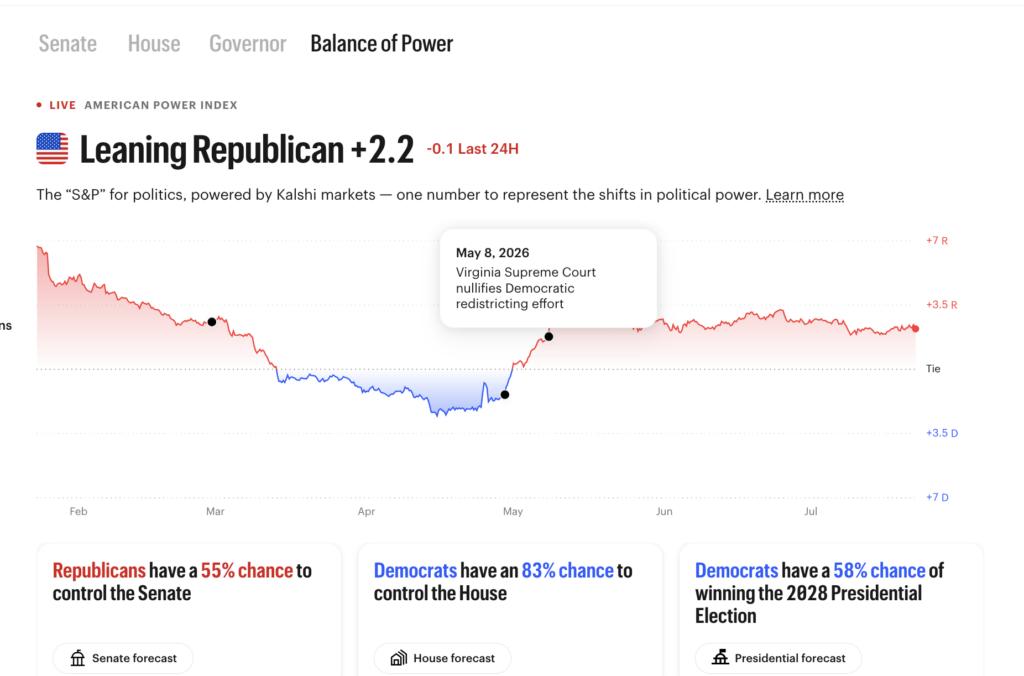
The hub’s Balance of Power tab adds another historical view through KPOW, Kalshi’s American Power Index, which launched earlier this year and combines current political control with market expectations in a single partisan reading. The index was leaning Republican by 2.2 points Wednesday morning.
Black markers on the KPOW chart identify selected developments that coincided with changes in the index’s trajectory. Examples include the Feb. 28 U.S. military operation in Iran, the April 29 Supreme Court decision in Louisiana v. Callais and the May 8 Virginia Supreme Court ruling that nullified a Democratic redistricting effort.
Race pages add polling and campaign-finance context
The hub extends beyond the national dashboards through “Race Intel” panels on individual market pages. The panels place Kalshi’s probabilities alongside polling averages, campaign fundraising, the share of money attributed to “small donors” giving $200 or less, and the Republican or Democratic presidential election margins in the jurisdiction in 2020 and 2024.
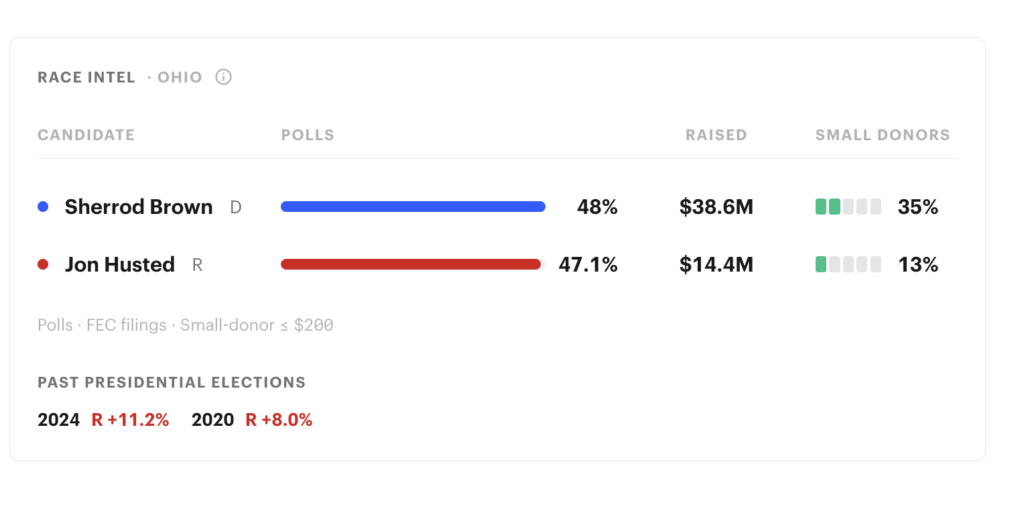
Kalshi said the polling averages come from VoteHub, while the fundraising figures draw on Federal Election Commission reports. The added context gives users a way to compare the market’s assessment with more traditional measures of a campaign’s position rather than viewing the odds in isolation.
The Race Intel data may be especially useful to campaigns themselves. Candidates, campaign managers and senior campaign staff are prohibited from trading on markets tied to the candidates they represent, but they can still view the public probabilities, polling, fundraising and historical election data. That gives campaigns another source of information they could use to track perceptions of a race and potentially shape strategy.
Kalshi election-market pages include an “Insider trading is prohibited” section listing people barred from trading a particular contract. Depending on the market, the restrictions can also cover people with material nonpublic information, political party leaders, certain government officials and staff, polling employees, immediate family members and household members of prohibited traders.
Kalshi touts election-market accuracy
Kalshi used the launch to argue that its election probabilities have proved reliable. The company said candidates favored by its U.S. election markets since 2024 have won roughly nine times out of 10, even when measured three months before Election Day. It also said outcomes priced at about 70% have occurred approximately 70% of the time.
The release pointed to a Washington Post analysis of hundreds of 2026 primary races that found candidates priced between 70% and 80% won 75% of the time. Kalshi did not provide the underlying dataset or detailed methodology for its broader performance claims in the release.
Those claims are central to the hub’s broader appeal because the maps, historical tools and Race Intel data become useful to campaigns and other nontraders only if they view the market prices as a meaningful signal alongside polls and conventional election forecasts.
More on 2026 Midterms