


After a busy weekend for NFL trading on Kalshi and Polymarket, both platforms saw week-over-week increases in notional volume to achieve new weekly all-time highs. Top prediction market exchanges overall reached a new high point as well, totaling just shy of $6 billion in notional volume for the week of Jan. 12-18.
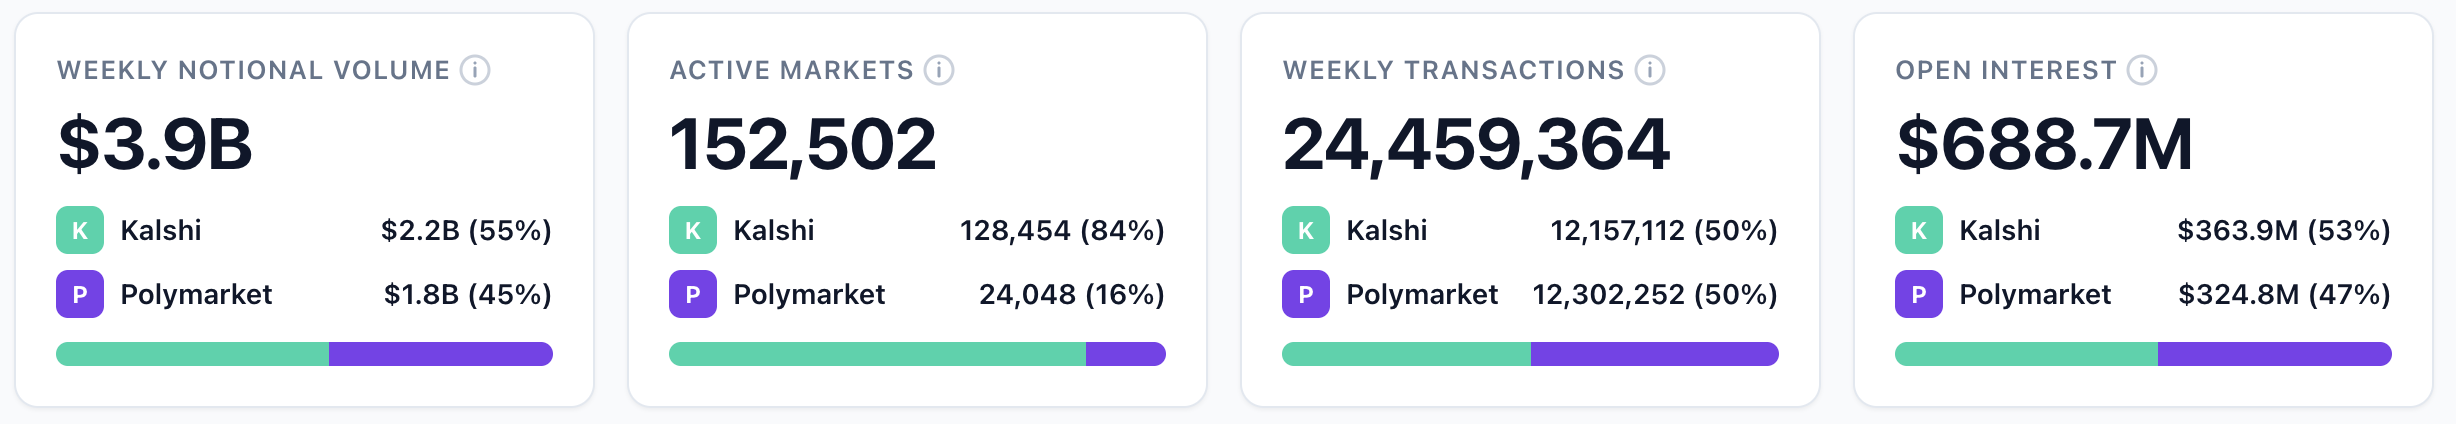
Kalshi’s market share was 35.9% to Polymarket’s 29.3% for the week ending Jan. 18. Here’s a look at top-level numbers for the two main prediction market players:
- Kalshi: $2.15 billion (+7.0% WoW)
- Polymarket: $1.76 billion (+16.9% WoW)
Interesting to note that Kalshi is riding a streak of 13 consecutive weeks of outperforming Polymarket on notional volume (since the week of Oct. 20), though a couple of those weeks the two were neck and neck. The last time Polymarket posted higher weekly volume was Oct. 13-19 when Polymarket had $1.06B to Kalshi’s $950.4M.
Kalshi vs. Polymarket volume for the week of Jan. 12-18:
Not included in our Notional Volume dashboard is Opinion, which Dune Data shows a notional volume of $1.94 billion (+21.6% WoW).
A quick look at the trading category data tells us that Kalshi’s lead over Polymarket is primarily driven by the platform’s overall focus on sports. Of Kalshi’s $2.15 billion notional volume last week, a whopping $1.95 billion came from sports. The weekend’s four NFL divisional round playoff games drove a total of $258.8 million in notional volume at Kalshi.
NFL Divisional Round trading volume at Kalshi:
| Game | Date/Time | Total Volume |
|---|---|---|
| Bills at Broncos | Jan. 17, 4:30 ET | $82,591,388 |
| 49ers at Seahawks | Jan. 17, 8 ET | $69,988,803 |
| Texans at Patriots | Jan. 18, 3 ET | $24,467,389 |
| Rams at Bears | Jan. 18, 6:30 ET | $81,774,498 |
Let’s dig into some of the other data of interest from the past week.
Overall platform comparison (week of Jan. 12-18)
Total notional volume across top prediction market platforms is up 14.5% week over week to $5.99 billion, but note that the platforms which Dune Data is currently tracking have shifted. Dune removed PredictIt from its tracking this week and added predict.fun and ForecastEx.
Top platforms market share for Jan. 12-18
| Platform | Notional Volume ($) | Market Share | WoW Change |
|---|---|---|---|
| Kalshi | $2,153,060,916 | 35.9% | +7.0% |
| Opinion | $1,941,759,497 | 32.4% | +21.6% |
| Polymarket | $1,758,081,905 | 29.3% | +16.9% |
| predict.fun | $113,624,631 | 1.9% | — |
| Limitless | $18,976,902 | 0.3% | +111.6% |
| ForecastEx | $5,520,486 | 0.1% | — |
| Myriad | $2,350,513 | <0.1% | +27.3% |
| Total | $5,993,374,850 | 100% | +14.5% |
Week-over-week volume and transactions compared
| Platform | Notional Volume ($) | WoW Change | Transactions | WoW Change |
|---|---|---|---|---|
| Kalshi | $2,153,060,916 | +7.0% | 12,157,112 | +9.7% |
| Opinion | $1,941,759,497 | +21.6% | 603,819 | −11.6% |
| Polymarket | $1,758,081,905 | +16.9% | 12,302,252 | +7.9% |
| predict.fun | $113,624,631 | — | 145,575 | — |
| Limitless | $18,976,902 | +111.6% | 194,743 | +26.4% |
| ForecastEx | $5,520,486 | — | 31,208 | — |
| Myriad | $2,350,513 | +27.3% | 201,283 | +20.7% |
| Total | $5,993,374,850 | +14.5% | 25,635,992 | +8.6% |
Kalshi and Polymarket continue to show healthy growth across both notional volume and weekly transactions, with Polymarket slightly edging Kalshi in total transactions despite trailing in volume.
Weekly users on the rise at Polymarket
Weekly users data shows Polymarket steadily climbing with more variance as expected for some smaller on-chain platforms. Opinion and Myriad in particular saw large drop-offs in weekly users as noted in the table below.
| Platform | Weekly Users | WoW Change |
|---|---|---|
| Polymarket | 269,784 | +3.1% |
| Opinion | 46,142 | −21.7% |
| Predict.fun | 8,828 | +9.3% |
| Limitless | 3,695 | −5.3% |
| Myriad | 2,104 | −28.8% |
| *Total | 330,553 | −1.5% |
*Note: Kalshi is excluded from the Dune weekly users data.
Opinion’s users dropped 21.7% and transactions are down 11.6% WoW while its volume jumped 21.6%, meaning average transaction size increased significantly. However, it’s possible that other noise like wash trading and multiple wallets are skewing these numbers.
Sports vs. the rest: Category breakdowns for week of Jan. 12
Sports remain the key driver of growth on both of the top platforms, though they make up a much higher share of total market volume on Kalshi. Last week, sports volume at Kalshi rose 6.2% WoW, but made up a slightly lower overall percentage of total notional volume (90.4% compared to 91.1%).
While sports continue to dominate, crypto and politics categories both saw large WoW increases in total volume (up 27.6% and 68.5%, respectively) to make up a higher percentage of the overall mix. Still, no single category outside of sports is generating more than 4% of total volume on the Kalshi platform.
Kalshi category breakdown week over week
| Category | Jan 5-11 Volume | Jan 12-18 Volume | WoW Change | Jan 5-11 Share | Jan 12-18 Share |
|---|---|---|---|---|---|
| Sports | $1,832,116,143 | $1,946,157,840 | +6.2% | 91.1% | 90.4% |
| Crypto | $58,637,180 | $74,836,416 | +27.6% | 2.9% | 3.5% |
| Politics | $27,396,302 | $46,172,705 | +68.5% | 1.4% | 2.1% |
| Mentions | $28,061,538 | $26,319,007 | −6.2% | 1.4% | 1.2% |
| Climate and Weather | $24,823,351 | $20,218,176 | −18.6% | 1.2% | 0.9% |
| Economics | $11,538,566 | $13,598,319 | +17.8% | 0.6% | 0.6% |
| Entertainment | $16,616,858 | $11,809,589 | −28.9% | 0.8% | 0.5% |
| Financials | $6,615,450 | $6,076,108 | −8.2% | 0.3% | 0.3% |
| Companies | $1,536,236 | $3,106,131 | +102.2% | 0.1% | 0.1% |
| Elections | $1,151,059 | $2,225,955 | +93.4% | 0.1% | 0.1% |
| Science and Technology | $1,908,675 | $1,793,605 | −6.0% | 0.1% | 0.1% |
| Other | $1,605,199 | $747,065 | −53.5% | 0.1% | <0.1% |
| Total | $2,012,006,557 | $2,153,060,916 | +7.0% | 100% | 100% |
At Polymarket, sports and politics remain the core volume drivers, with crypto and “Trump” categories also making up a significant portion of total notional volume. Note: We will update with Polymarket’s category breakdown data once it is available.